Using Confidence Data with Student Responses
I tried something new today with my students – I asked them to rate their confidence in their answers on a 1 (total guess) to 4 (definitely know I know it) scale. I collected the aggregate information for each class and started flagging issues.
First, this only took me about 5 minutes to do. So, after we finished the questions, they started working on their review for our test this week. I pulled in the numbers, ran a formula or two, and had the percent correct for each item as well as the average confidence. Then, we started talking about what they noticed.
Some noticed right away that a few questions were more missed than others. Someone also noticed that questions with a high percent correct tended to have a high confidence rating. The same was true for lower-scoring questions. I then pointed out what I was really interested in:
Discrepancy.
I saw nods and furrowed brows as I pointed out low-scoring questions with high confidence ratings. It doesn’t compute. If so many people got it wrong, why were we so sure it was right?
This highlights areas I need to go back and review again, which is really nice. It also helps students reach a metacognitive place on their own work – it was only 6 questions, so they know what they got right and wrong.
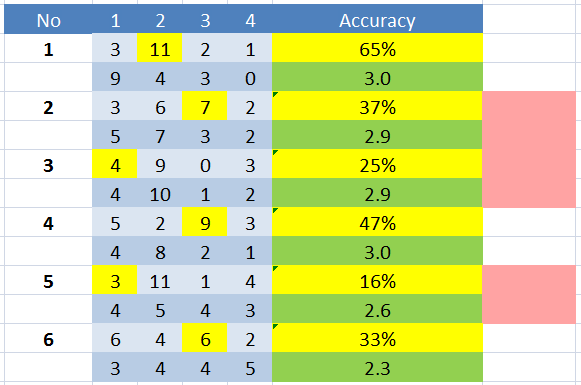
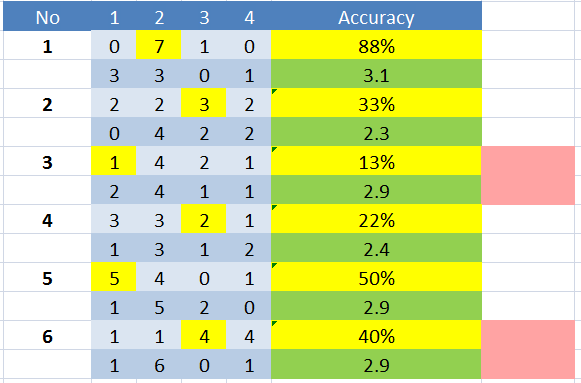
Different classes, different priorities.
And then here’s the aggregate data for all classes:
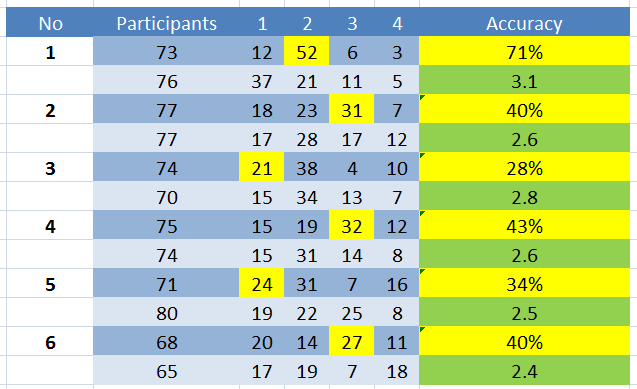
For now, I’m adding the red flags myself based on an arbitrary percentage and confidence level discrepancy. I’m doing that because I don’t know of any other way to make that comparison. So, here’s the question:
Are there statistical analyses that can be done on two-variable data (correct vs. confidence) which can then highlight areas significantly lower than expected?
I even went so far as to perform a correlation test on the data, which shows a definite positive correlation between the score and student confidence:
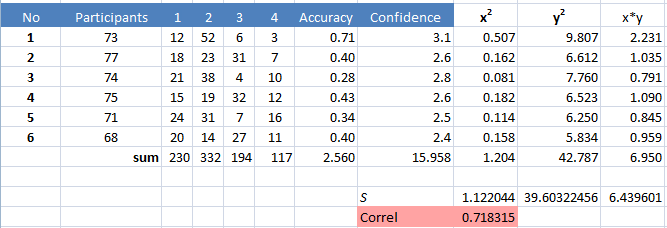
But again, I don’t know how to set up that discrepancy benchmark statistically. I may be thinking too hard about this, but I’d really like to have more to go on than, “This one is low compared to confidence.” It’s also a very small sample, and I know most correlation tests (t-Test, ANOVA, etc) require 10 samples, usually, so I’m not putting a ton of weight on the stats.
If you have any experience in this kind of analysis, I’d appreciate some pointers in the comments.
Comments